
Calling precise market tops and bottoms is next to impossible in the volatile cryptocurrency markets. That said, some traders believe identifying speculative bubbles and moments of bearish exhaustion can be made possible through the use of a fairly new metric known as the Mayer Multiple.
Created by noted investor and podcast host Trace Mayer, the Mayer Multiple is defined as “the multiple of the current bitcoin price over the 200-day moving average.”
Mayer Multiple Formula:
Bitcoin market price / 200 day MA value = Mayer Multiple
In technical analysis, it’s generally considered a bullish (or positive) indicator when prices are above the long-term moving average (MA), whereas it’s considered bearish (or negative), when the price is below the moving average.
However, the implications are not that binary. For example, if the price is significantly higher than a long-term moving average, it’s often a sign that the underlying asset has become overvalued or what is commonly referred to as “overbought.” The opposite is the case when the price falls excessively below the moving average.
The Mayer Multiple essentially quantifies the gap between the price and 200-day MA to identify historical values at which point bitcoin enters a speculative bubble. In other words: when its price significantly exceeds its intrinsic value or points of seller exhaustion.
Mayer Multiple: Bitcoin
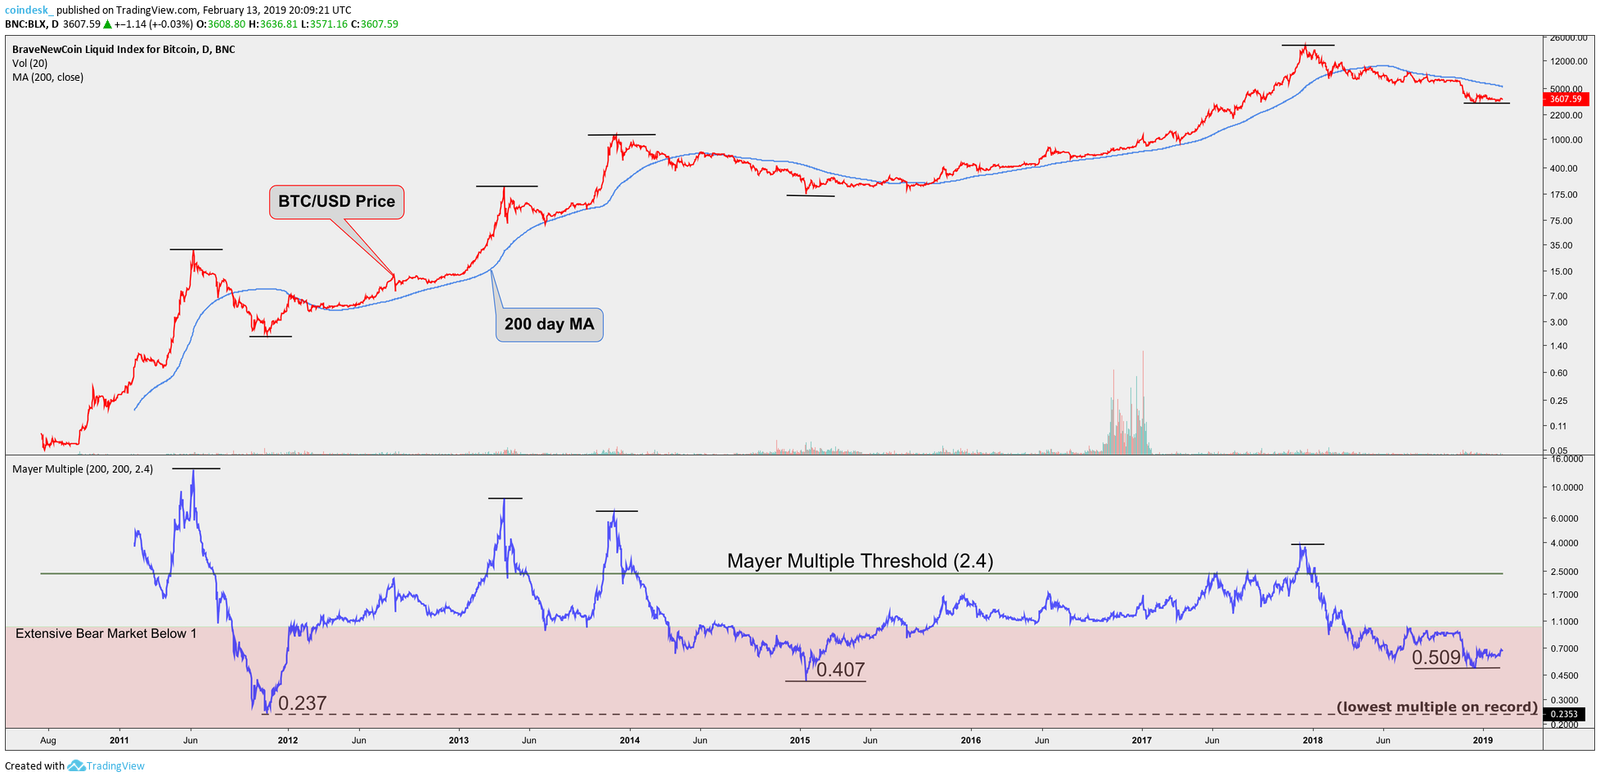
When using Mayer Multiple, the two specific values to pay keen attention to are 1 and 2.4. The significance of a 1 multiple is simple: any value above 1 means bitcoin’s price has risen above the 200-day MA and any value below 1 means price has fallen beneath it.
By comparing multiples below 1 to its corresponding price action, it is evident that extensive bear markets take place when price finds acceptance below the 200 MA. On the other hand, bitcoin’s market favors the bulls when the Mayer Multiple is above 1 – but there’s an exception.
Any multiple above the 2.4 threshold has historically shown to signify the beginning of a speculative bubble, which is significant because all bubbles eventually burst, causing a rapid depreciation. By conducting simulations based on historical data, Mayer deduced that the best long-term results were gathered by accumulating bitcoin when the Mayer Multiple was below 2.4.
As can also be seen above, the Mayer Multiple has never fallen below 0.237, the value that marked the bottom of bitcoin’s first significant bear market in 2011.
For reference, the 2013-15 bear market reached a price bottom when the multiple showed 0.407 and the lowest multiple since then was 0.509, when bitcoin’s price fell to $3,122 on Dec. 15, according to CoinDesk pricing data.
As the data suggests, bitcoin’s price is now reaching historically oversold levels so its presumed a bottom is in sight, but is still capable of falling further away from the 200-day MA, which is currently sitting at $5,343. Further, evidence suggests that it’s highly likely the price finding acceptance above the 200-day MA, creating a Mayer Multiple above 1, would confirm the beginning of a bull market.
And finally
An above-1 Mayer Multiple could be considered a sign of a bull market.
A very high number represents extreme overbought conditions or bubble. BTC, therefore, could see a corrective pullback or an outright sell-off, in which case prices may eventually drop below the 200-day MA, driving the Mayer Multiple below 1.
However, that could turn out to be a bear trap, as a sharp drop from extreme overbought conditions to levels below 200-day MA is usually accompanied by short-term overbought conditions.
An unusually low number could be considered an advance indicator of bitcoin nearing a major bottom.
Disclosure: The author holds BTC, AST, REQ, OMG, FUEL, ZIL, 1st and AMP at the time of writing.
Bitcoin and chart image via Shutterstock; charts by TradingView
Previous Articles:
- Orca Pool Mining Operation Aims to Defend Altcoins and Forks From Attacks
- Judge Delays Legal Representation Choice For QuadrigaCX’s Affected Users
- Bitcoin Cash Locks in Schnorr Signatures for May Upgrade, Devs Say More Privacy and Efficiency
- What QuadrigaCX Says About Institutional Crypto Investment
- Court Reconsiders Ruling After SEC Proves Tokens Are Securities

