
Bitcoin’s user growth, as represented by active addresses, has spiked in the last eight weeks leaving the price far behind, a move that contradicts the popular belief the two tend to move in tandem.
The 30 day average of active addresses on bitcoin’s blockchain, or the number of accounts that made cryptocurrency transactions at any point during the last 24 hours, total 664,064 as of March 16– up 17 percent from 569,812 seen on Jan. 20. Bitcoin’s 30 day average price, however, has increased just 1 percent during the same time span, according to Coinmetrics.
An uptick in active addresses is taken by many as a sign of the cryptocurrency’s increasing popularity or investor confidence. The active addresses count, however, tends to rise even when long-term dormant “HODLers” move out of the cryptocurrency and into fiat.
So, betting on a price rise every time active addresses spike could prove costly.
Other network activity metrics like the network volume and the transaction amount to active addresses ratio (TAAR) tend to shed more light on how network activity impacts bitcoin’s price.
Active Addresses vs. BTC/USD

*coinmetrics.io
As can be seen above, the divergence between active addresses and bitcoin’s price has become quite large, which perhaps comes as a surprise given the two rose and fell in unison for much of 2018.
But while the divergence between the two metrics is indeed growing, it’s hardly been the first time such a development has occurred.
For instance, active addresses maintained notable growth throughout the entire bear market that spanned nearly two years from 2014 to early 2016, which implies active addresses may not be the most predictive fundamental metric for bitcoin’s price.
Since active addresses are only a measure of how many accounts are actively making transactions, other metrics like network volume and TAAR can be used to provide insight into the actual amount of funds the addresses are spending.
Transaction Volume vs. BTC/USD
As can be seen in the chart below, the 30-day average of bitcoin’s network volume, or the amount of funds (USD) transmitted through its blockchain, appears to have a much stronger relationship with the price of BTC/USD than the trend of active addresses.
Perhaps not coincidentally, when viewed on Coinmetrics’ semi-log graph, the 30-day avg. of transaction volume has been quite precise in identifying bitcoin market tops and bottoms, as depicted by the average line either falling below or rising above prices.

*coinmetrics.io
Upon closer examination, it can be seen the network volume has also seen an uptick over the past couple of weeks.
The 30-day average of network volume has increased from $2.24 billion on Feb. 17, to $2.86 billion on March 16, an increase of roughly 27 percent. In the same time bitcoin’s average price increased just over 8 percent from $3,568 to $3,862.
Indeed, bitcoin’s transaction volume appears to track prices more accurately, but since the number of active addresses is also a valid reflection network usage, it’s worth viewing how the interplay between the two impact bitcoin’s price, if at all.
Transaction Amount to Active Addresses Ratio (TAAR)
First introduced by founder of Pugilist Ventures, Chris Brookins, the TAAR metric “acts as an “equilibrium” gauge of bitcoin’s price to fundamentals valuation, where transaction volume and active addresses both represent “quantity and quality” growth of the bitcoin network”
In other words, TAAR represents how the interplay between the two metrics that measure the quantity (transaction volume) and quality (active addresses) of network activity impacts bitcoin’s price as opposed to viewing their effects in isolation.
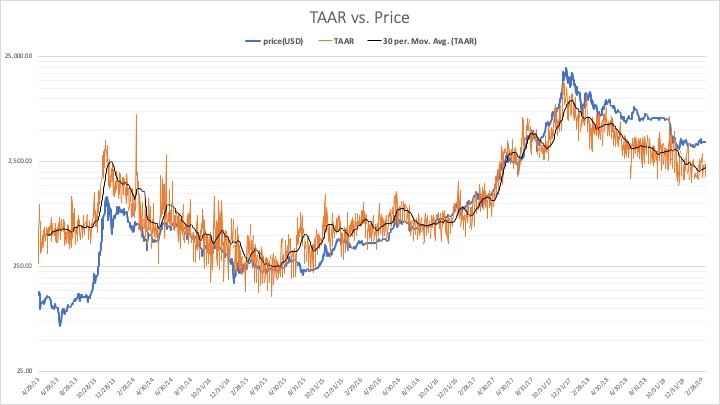
While the sample size is small, spanning only a few years, it is clear that bitcoin’s market reacts positively when the TAAR is in an uptrend and reacts negatively when it is not.
As can be seen, however, the TAAR is still in an apparent downtrend and has deviated from bitcoin’s price trend, indicating the fundamental metrics that measure the quality and quantity of activity on bitcoin’s blockchain is not at equilibrium with its price.
Conclusion
Active addresses are indeed growing faster than bitcoin’s price is increasing, but the metric only tells half the story. The amount of funds passed through the blockchain, known as network volume, is also a key measure of network activity, as it shows how much is being transferred, not just how many accounts are conducting transactions.
When the interplay between the two is depicted, the TAAR metric shows bitcoin’s network activity has room to grow before confirming a bullish effect on the market.
Disclosure: The author holds BTC, LTC, ETH, ZEC, AST, REQ, OMG, FUEL, ZIL, 1st and AMP at the time of writing.
BTC mining via Shutterstock; Charts by TradingView
Previous Articles:
- Bank of Mexico’s Attempt to Regulate Crypto ‘Is a Disaster,’ Exchange CEO Explains
- When Bakkt? Bitcoin Futures Market’s Approval Appears Stuck in Limbo
- Bitcoin May Just Be Hamas’ Refuge in Financial Siege
- How Ethereum Applications Earn A+ Security Ratings
- Bitcoin Cash Developers Launch Privacy-Preserving Light Client Neutrino

