Don’t Let the Bitcoin Price Rise Fool You, We’re Still Going to $2,500
The sideways movement of the bitcoin price has been extended longer than expected. Because of that unexpected development, we now have contradictory bullish and bearish signals showing up in the charts, meaning we may have to reconsider some parts of our previous analyses.
Also read: Australia’s Two Main Blockchain Industry Lobbying Groups to Merge
Subscribe to the YouTube channel for great videos featuring industry insiders & experts
Bitcoin Price Technical Analysis
Long-Term Analysis

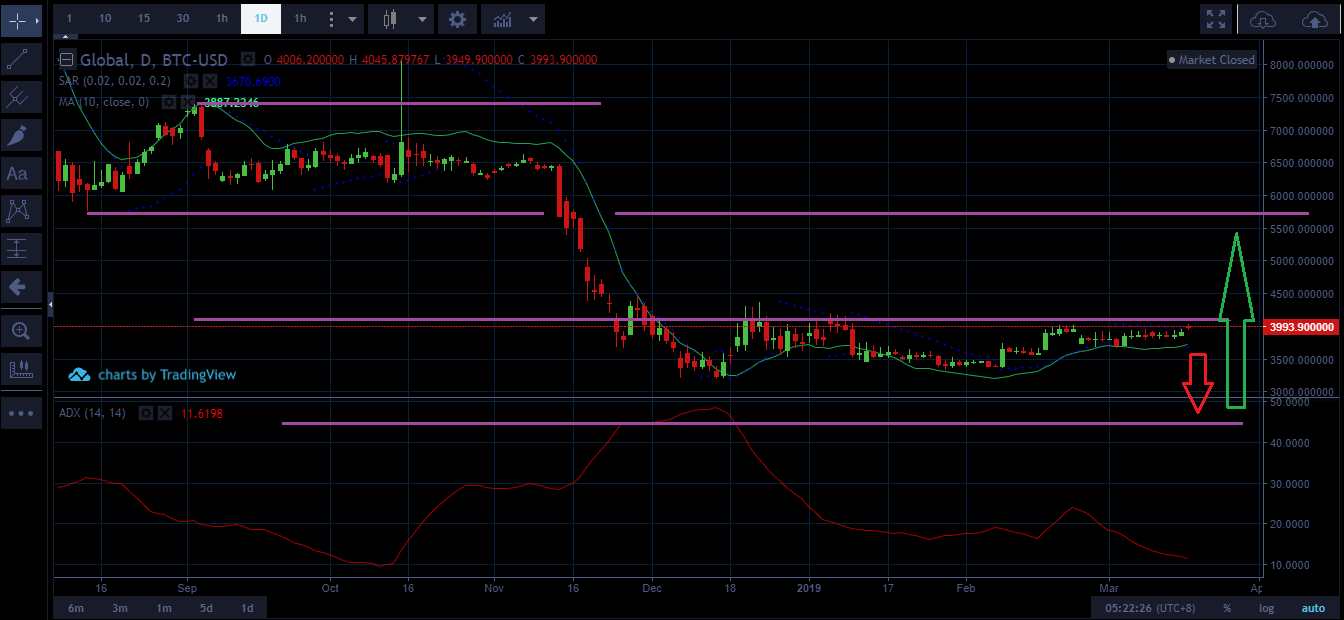
After another week of sideways movement — and considering Mass Psychology Analysis — it looks like the bearish swing to $2,500 USD has been delayed. However, it will still happen and it will still mark the end of the downtrend that has dominated the market since December 2017.
According to Round Numbers Theory, the current bitcoin price level depends totally on external factors. That weakness exposes the market to a plunging risk with $2,500 as a target. From there, we can expect a bounce that will overcome the distribution zone between $4,000 and $4,500, driving the action near $6,000.
Mid-Term Analysis

While the bitcoin price has held steady at $3,000 for some time, there is no technical support for that level. Therefore, even though the lateral market has been extended for another week, we can expect a drop to $2,500, which will end the bearish trend and reset the cycle.
Once that drop happens, technical indicators suggest that a bullish cycle will begin, sending the price beyond the $4,000 resistance.
Short-Term Analysis

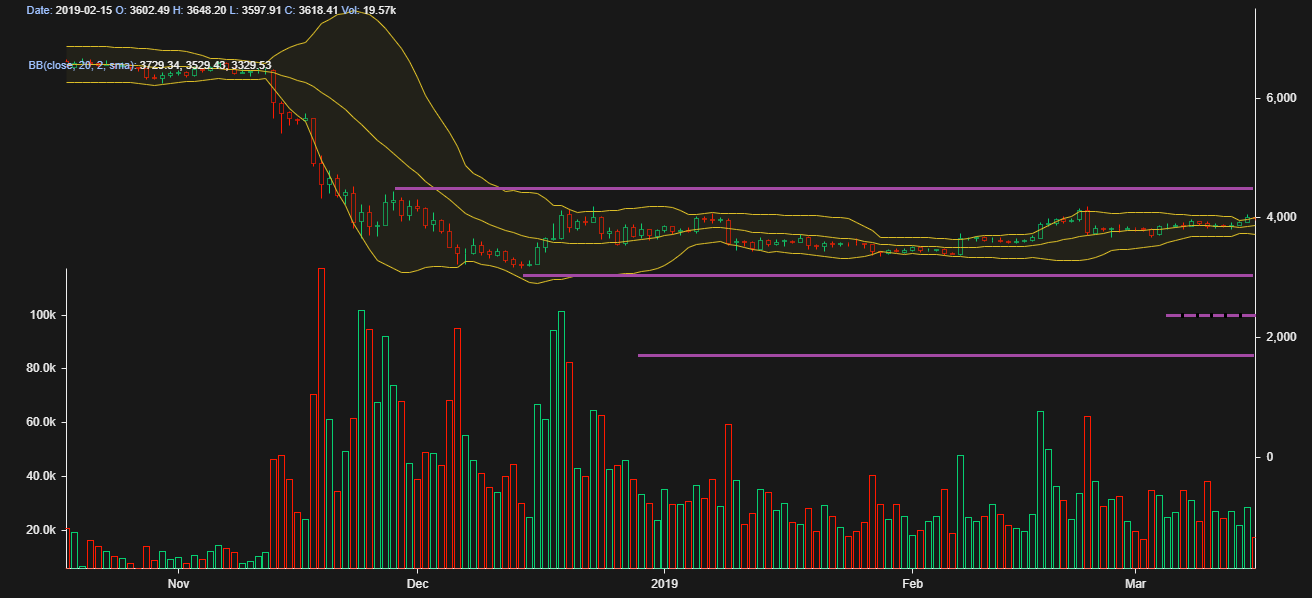
Bollinger Bands reflect a tangled lateral market, showing contradictory bullish and bearish signals every hour. In light of those conflicting signals, quotes from the last week have not followed the signals necessary to define the ongoing trend. This action has led to the extension of the sideways market.
Furthermore, since every attempt to break out of this sideways trend has become a dead cat bounce that sends the bitcoin price back to the Bollinger center line, there is strong support for the next downward movement. This movement will see the price fall to $2,500, after which it will quickly climb and overcome the $4,100 resistance.
If this pattern confirms, the market will collect big buy orders, which will boost the action upwards between $5,800 and $7,500.
What do you think will happen to the bitcoin price? Share your predictions in the comments section.
If you find Ramiro’s analyses interesting or helpful, you can find out more about how he comes to his conclusions by checking out his primer book, the Manual de Análisis Técnico Aplicado a los Mercados Bursátiles. The text covers the whole range of technical analysis concepts, from introductory to advanced and everything in between. To order, send an email to [email protected]

Image via Pixabay
This technical analysis is meant for informational purposes only. is not responsible for any gains or losses incurred while trading bitcoin.
Previous Articles:
- 1confirmation, Canaan Partners Back Startup Pushing New Spin on Airdrops
- 87% of Crypto Exchanges May be Falsifying Volume
- Digitec Galaxus Accepts Cryptocurrency Payments And Looks To Educate Its Customers
- Bitcoin Struggles to Pass Key Price Resistance Over $4K
- In the Daily: Crypto Data Feed, BSV Sale, Bitmain Office Closed
