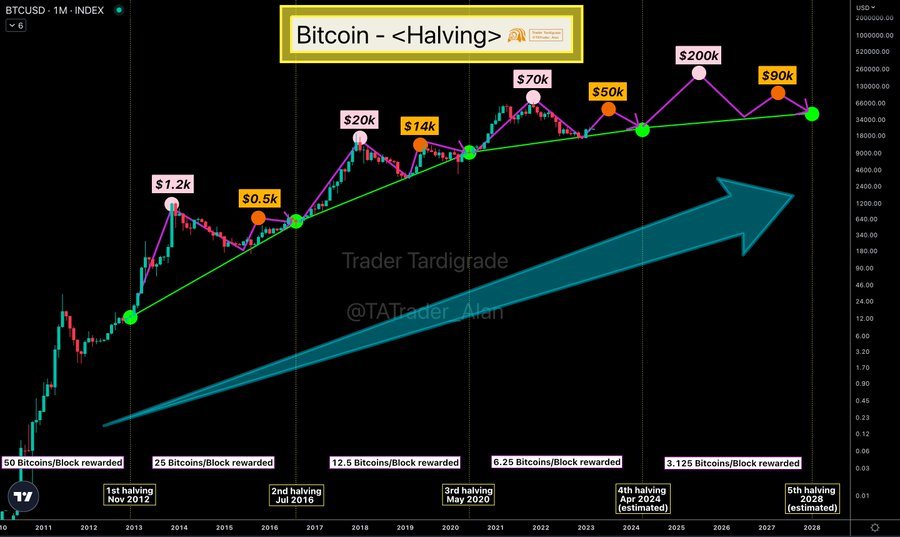
The current Bitcoin cycle is 75% of the way to the next “Halving”, which creates a good juncture to check what previous cycles looked like when BTC was at a similar stage in terms of timing.
The “Halving”
Halving” refers to a periodic event where the rewards received by Bitcoin miners are halved. These Bitcoin rewards that miners receive are also the only way to introduce new coins into the general circulating supply, meaning that the rewards miners receive can also be seen as the equivalent of “producing” new BTC.
The reason “Halving” exists as a concept is to limit the amount of Bitcoin available by making it rarer over time, as fewer and fewer coins are produced in each four-year period that “Halving” occurs.
Since “Halving” has these effects on the supply-demand dynamics of Bitcoin, this event historically brings an impact on the price of BTC. More specifically, as supply decreases after Halving, the value of BTC has historically recorded an upward trend.

Determines the start and end of each cycle
Each “Halving” occurs after every 210,000 blocks or roughly every four years. Because of this periodicity and the significant position they have gained in the market, “Halving” serve as a popular way of determining the start and end points of a BTC “cycle”.
The chart above shows the status of the current Bitcoin cycle, and how it compares to previous cycles when they were in similar stages. As can be seen, Bitcoin’s so-called bull runs have historically taken place after “halving”, showing how strong the trend is becoming.
From the chart it can be seen that the current cycle – according to “Halving” – is about 75% complete, meaning that miners have mined about 157,500 blocks.
What the two previous cycles have shown
While the trends followed by the two previous cycles after reaching similar time milestones differed from each other, they observed a general upward trend for at least some time after this point.
In the case of the 2012 cycle, the asset price continued to rise after the 75% threshold and “built up” until the next Bull Run. The 2016 cycle reached this milestone while the price was in the middle of the April 2019 rally.
The price continued to rise for a while after the offending time point and eventually the rally reached its peak and subsequently Bitcoin retreated. The “building” towards the Bull Run occurred during the “Halving” of 2020, i.e. at the start of the current cycle.
The April 2019 rally has many similarities to the rally we saw from the beginning of 2023 in terms of the various indicators within the Bitcoin chain, so it is interesting that its placement on the timelines of the respective cycles is quite similar.
What we will now see
It now remains to be seen where the price of Bitcoin will be driven from where it is today and whether the uptrend pattern following the 75% milestone before “Halving” will hold true in this cycle.
READ NEXT
- Should You Invest In Bitcoin In 2023?
- Curve Finance to Launch crvUSD Stablecoin in Ethereum Network
- Bitcoin Rises as Investors Turn to Cryptocurrencies Amid US Banking Sector Pressures
- Bitcoin to Outperform All Other Cryptocurrencies, Says Peter Brandt
- Bhutan and Bitdeer Plan $500 Million Fund for Green Bitcoin Mining
- Coinbase Launches International Derivatives Exchange Amid Regulatory Uncertainty
Previous Articles:
- Should You Invest In Bitcoin In 2023?
- Curve Finance to Launch crvUSD Stablecoin in Ethereum Network
- Bitcoin Rises as Investors Turn to Cryptocurrencies Amid US Banking Sector Pressures
- Bitcoin to Outperform All Other Cryptocurrencies, Says Peter Brandt
- Bhutan and Bitdeer Plan $500 Million Fund for Green Bitcoin Mining
